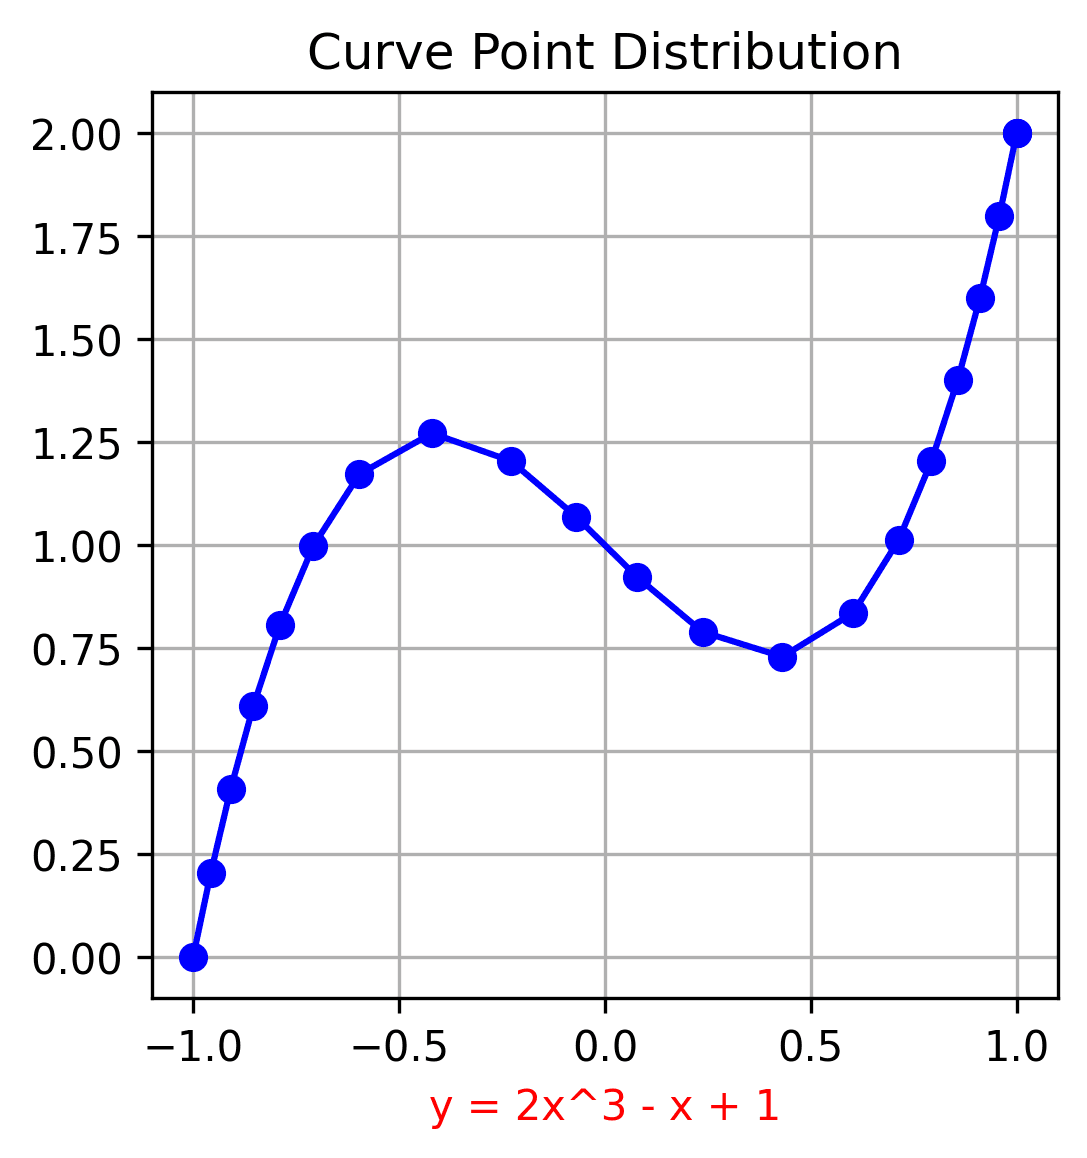
Curve Point Distribution
This implementation’s purpose is to distribute a desired number of points on the curve by equal path distance to each other. To do that, I applied an adaptable unit length strategy while trying to keep the segment length error percent is less than 1% by sweeping small increments on x axis . Later on, I will work on some improvements to reduce errors.
Here, I chose the curve function y = 2x^3 – x + 1 within [-1, 1] range by 20 points and 0.001 delta_x:
import numpy as np
from scipy.integrate import quad
import matplotlib.pyplot as plt

class Point:
    def __init__(self, _x, _y):
        self.x = _x
        self.y = _y

def function(x):
    # Taking quadratic function y = 2x^3 - x + 1 as an example
    return 2 * x**3 - x + 1

def integrand(x):
    return np.sqrt(36 * x**4 - 12 * x**2 + 2)

def curve_Length(a, b):
    curveLength, _ = quad(integrand, a, b)
    return curveLength

def calculate_Curve_Points(numPoints, deltaX, a, b):

    curvePointCoordinates = []

    # First point as a reference start (lower bound)
    x = a
    y = function(x)
    curvePointCoordinates.append(Point(x, y))

    # Sweeping from lower bound to upper bound to get x axis value
    # First and last point calculations are excluded

    for k in range(numPoints - 1):
        delta_x = deltaX
        lowerBound = curvePointCoordinates[k].x

        # Adaptable unit length after each error margin
        unitLength = curve_Length(lowerBound, b) / (numPoints - 1 - k)

        while True:
            upperBound = lowerBound + delta_x
            segmentLength = curve_Length(lowerBound, upperBound)

            # Error percentage
            error = 100 * abs(unitLength - segmentLength) / unitLength

            if error <= 0.1 or segmentLength >= unitLength:
                x = upperBound
                y = function(x)
                curvePointCoordinates.append(Point(x, y))
                print("The error of segment", k+1,":", round(error, 2), "%")
                break
            delta_x += deltaX

    # Last point
    x = b
    y = function(x)
    curvePointCoordinates.append(Point(x, y))

    # Extract x and y coordinates from curve_point_coordinates
    x_coords = [point.x for point in curvePointCoordinates]
    y_coords = [point.y for point in curvePointCoordinates]

    # Plot the curve
    plt.figure(dpi=300)
    plt.plot(x_coords, y_coords, marker='o', linestyle='-', color='b')
    plt.title('Curve Point Distribution')
    plt.xlabel('y = 2x^3 - x + 1', color='r')
    plt.grid(True)
    plt.gca().set_aspect('equal', adjustable='box')  # Set equal aspect ratio
    plt.show()

    return

if __name__ == "__main__":

    numPoints = 20
    deltaX = 0.001
    a = -1.0  # lower bound
    b = 1.0   # upper bound

    calculate_Curve_Points(numPoints, deltaX, a, b)
[1] Arc Length Formula [2] Desmos calculator
